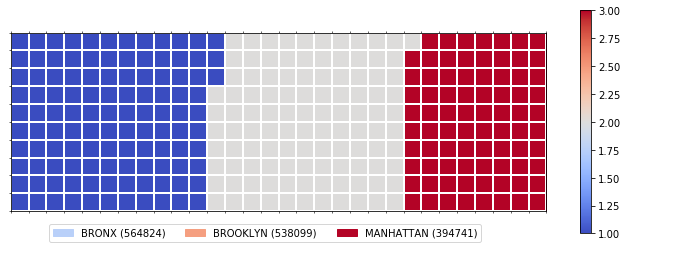
我无法让图表图例颜色与实际绘图颜色相匹配。他们都关闭了,有些关闭了。我将在下面发布代码以及我为达到最终情节所采取的步骤。
这是我最终得到的:
import pandas as pd
import numpy as np
import matplotlib as mpl
import matplotlib.pyplot as plt
import matplotlib.patches as mpatches # needed for waffle Charts
%matplotlib inline
#The Data Frame:
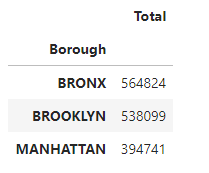
borough3_df=borough_df.loc[['BRONX','BROOKLYN','MANHATTAN']]
borough3_df.head()
自治市镇已设置为索引,另一列是“总计”
步骤 1. 我采取的第一个是确定每个类别相对于总数的比例。
# compute the proportion of each category with respect to the total
total_values = sum(borough3_df['Total'])
category_proportions = [(float(value) / total_values) for value in borough3_df['Total']]

# print out proportions
for i, proportion in enumerate(category_proportions):
    print (borough3_df.index.values[i] + ': ' + str(proportion))

BRONX: 0.3771366608264604
BROOKLYN: 0.35929220439297466
MANHATTAN: 0.26357113478056493
第 2 步。第二步是定义华夫饼图的整体尺寸。
width = 30 # width of chart
height = 10 # height of chart

total_num_tiles = width * height # total number of tiles
Step 3. 第三步,使用每个类别的比例来确定其各自的瓦片数量
# compute the number of tiles for each catagory
tiles_per_category = [round(proportion * total_num_tiles) for proportion in category_proportions]

# print out number of tiles per category
for i, tiles in enumerate(tiles_per_category):
    print (borough3_df.index.values[i] + ': ' + str(tiles))
布朗克斯:113 布鲁克林:108 曼哈顿:79
第 4 步。第四步是创建一个类似于华夫饼图的矩阵并填充它。
# initialize the waffle chart as an empty matrix
waffle_chart = np.zeros((height, width))

# define indices to loop through waffle chart
category_index = 0
tile_index = 0

# populate the waffle chart
for col in range(width):
    for row in range(height):
        tile_index += 1

        # if the number of tiles populated for the current category is equal to its corresponding allocated tiles...
        if tile_index > sum(tiles_per_category[0:category_index]):
            # ...proceed to the next category
            category_index += 1

        # set the class value to an integer, which increases with class
        waffle_chart[row, col] = category_index
步骤 5. 将华夫饼图矩阵映射为视觉对象。
# instantiate a new figure object
fig = plt.figure()

# use matshow to display the waffle chart
colormap = plt.cm.coolwarm
plt.matshow(waffle_chart, cmap=colormap)
plt.colorbar()

# get the axis
ax = plt.gca()

# set minor ticks
ax.set_xticks(np.arange(-.5, (width), 1), minor=True)
ax.set_yticks(np.arange(-.5, (height), 1), minor=True)

# add gridlines based on minor ticks
ax.grid(which='minor', color='w', linestyle='-', linewidth=2)

plt.xticks([])
plt.yticks([])

#ADDITIONS

# compute cumulative sum of individual categories to match color schemes between chart and legend
values_cumsum = np.cumsum(borough3_df['Total'])
total_values = values_cumsum[len(values_cumsum) - 1]

# create legend
legend_handles = []
for i, category in enumerate(borough3_df.index.values):
    label_str = category + ' (' + str(borough3_df['Total'][i]) + ')'
    color_val = colormap(float(values_cumsum[i])/total_values)
    legend_handles.append(mpatches.Patch(color=color_val, label=label_str))


# add legend to chart
plt.legend(handles=legend_handles,
           loc='lower center',
           ncol=len(borough3_df.index.values),
           bbox_to_anchor=(0., -0.2, 0.95, .1)
          )
布朗克斯应该是深蓝色布鲁克林应该是浅蓝色曼哈顿似乎工作得很好。
这是图像: